
Energy Monitoring in Manufacturing: How Real-Time Data Cuts Costs
Energy costs represent between 8% and 15% of total production costs in most manufacturing sectors. Yet in the majority of industrial facilities, energy is managed the same way it was twenty years ago: monthly invoices, annual audits, and manual meter readings that tell you what happened — not what’s happening right now.
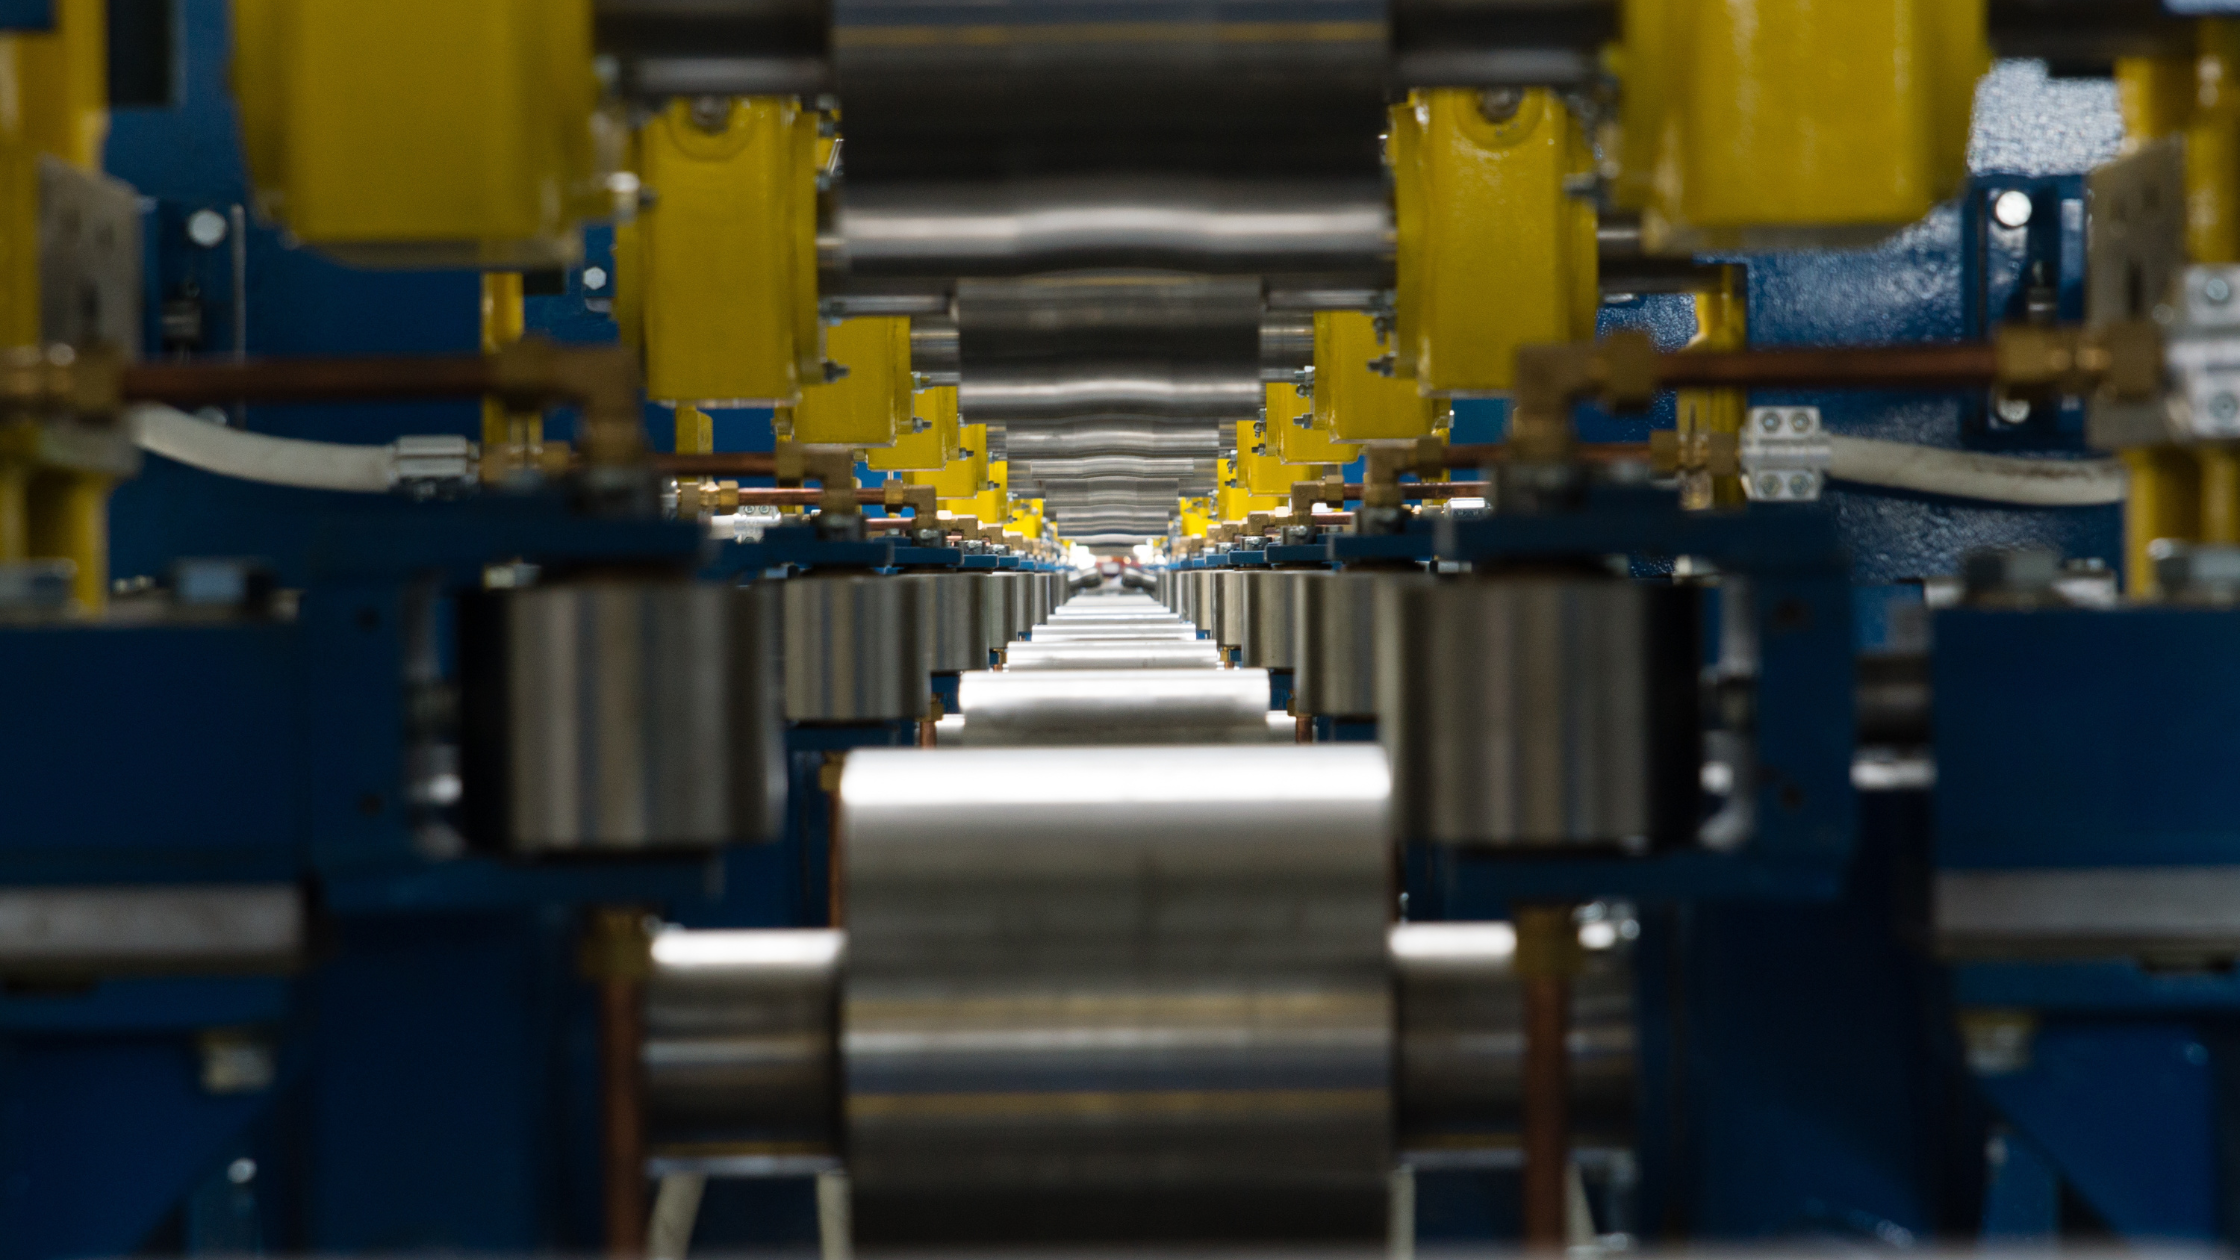
The Visibility Problem
Most manufacturers don’t have real-time energy visibility at the machine or production line level. They see a total facility consumption figure from their utility provider, but have no way to break it down by asset, shift, or process.
Without that granularity, cost-reduction efforts are guesswork. You might know your bill went up by 12% last quarter — but you don’t know which machine, which shift, or which process drove it.
What Real-Time Energy Monitoring Looks Like
With the right IIoT setup, every energy meter in your facility can send live data to the cloud every few seconds. That data is organized by asset, production line, building zone, or shift — however your operation is structured.
From a single dashboard, operations managers can see:
• Which machines are consuming the most energy right now.
• Whether consumption is tracking within expected ranges for the current production schedule.
• Alert notifications when a motor, compressor, or HVAC unit spikes unexpectedly.
• Historical consumption reports for benchmarking and reporting.
This is the difference between managing energy and monitoring energy.
A Real Example: The Food Processing Plant
A food processing company with three production shifts was struggling to understand its energy costs. They had meters installed throughout the facility but no way to aggregate or visualize the data in real time.
After connecting their energy meters to coppioT, a live Power BI dashboard was running within weeks. The first analysis revealed that a single compressed air system was consuming 23% more energy than expected during the night shift — a finding that would have taken months to surface through manual reporting.
The savings from that one discovery covered the project cost.
Getting Your Energy Meters Connected
coppioT supports the most common energy meter protocols — Modbus TCP, Modbus RTU, and M-Bus — meaning your existing hardware can be connected without replacement.
Setup is visual and no-code. Define your meters, map the data registers you want to capture (voltage, current, active power, reactive power, etc.), set your cloud destination, and your energy data starts flowing.
👉 Find out where your energy is really going. Connect your meters with coppioT’s Proof of Concept and have a live energy dashboard running in days. Visit coppiot.com.
